
Hey Hey, investors,
I’m not a fundamentalist; I’m a pure chartist. But saying this does not mean I won’t look at fundamentals; I do sometimes, but 80% of my work focus on looking at price action and interpreting the movement behind it. (psychological behavior of mass market participants). I always told my friends & family members that one should focus on your strengths and leverage others’ expertise. So this is me doing what I’m good at, providing insight to my fellow investors.
1: The Rise Of Tesla stocks.
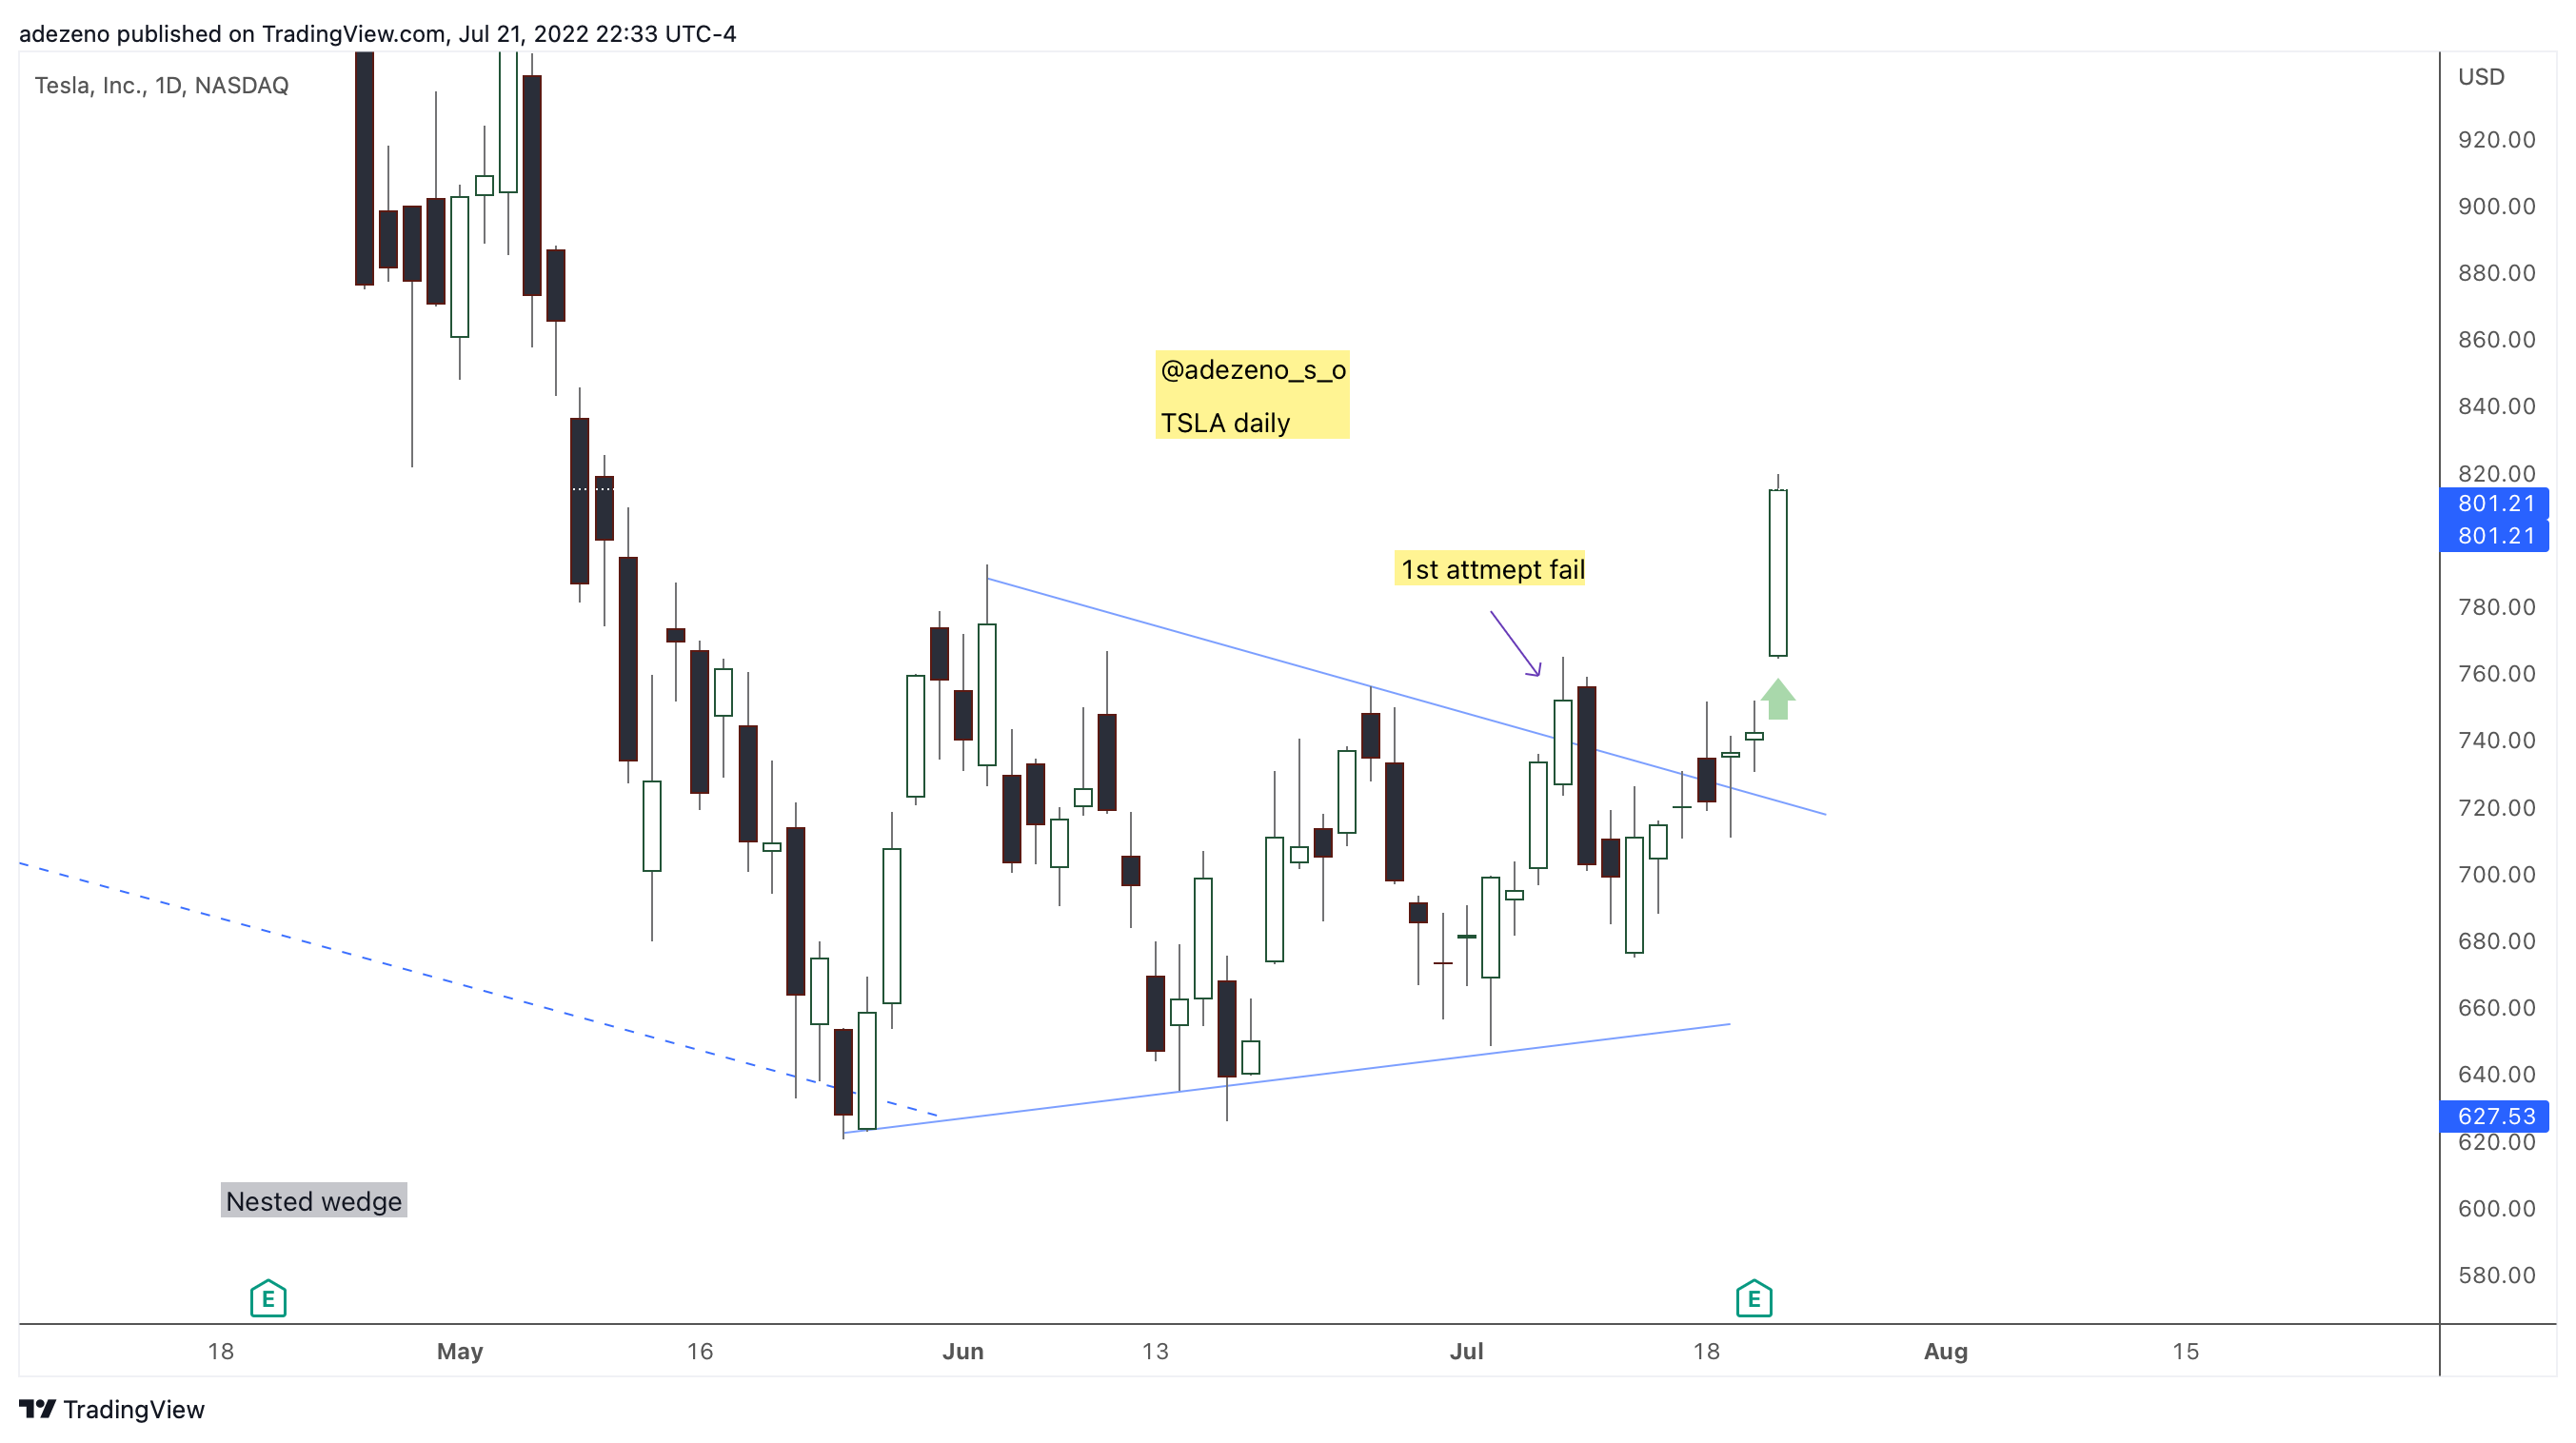
There is a specific rule in drawing a classical chart pattern (i showed this only for my premium members).
You will see the initial breakout from the descending triangle failed. However, it succeeds in the 2nd attempt.
2: The Rise of Amazon stocks.
I covered this in my newsletter yesterday; you can see my analysis here:

3: The Rise of Meta (Facebook) stocks.
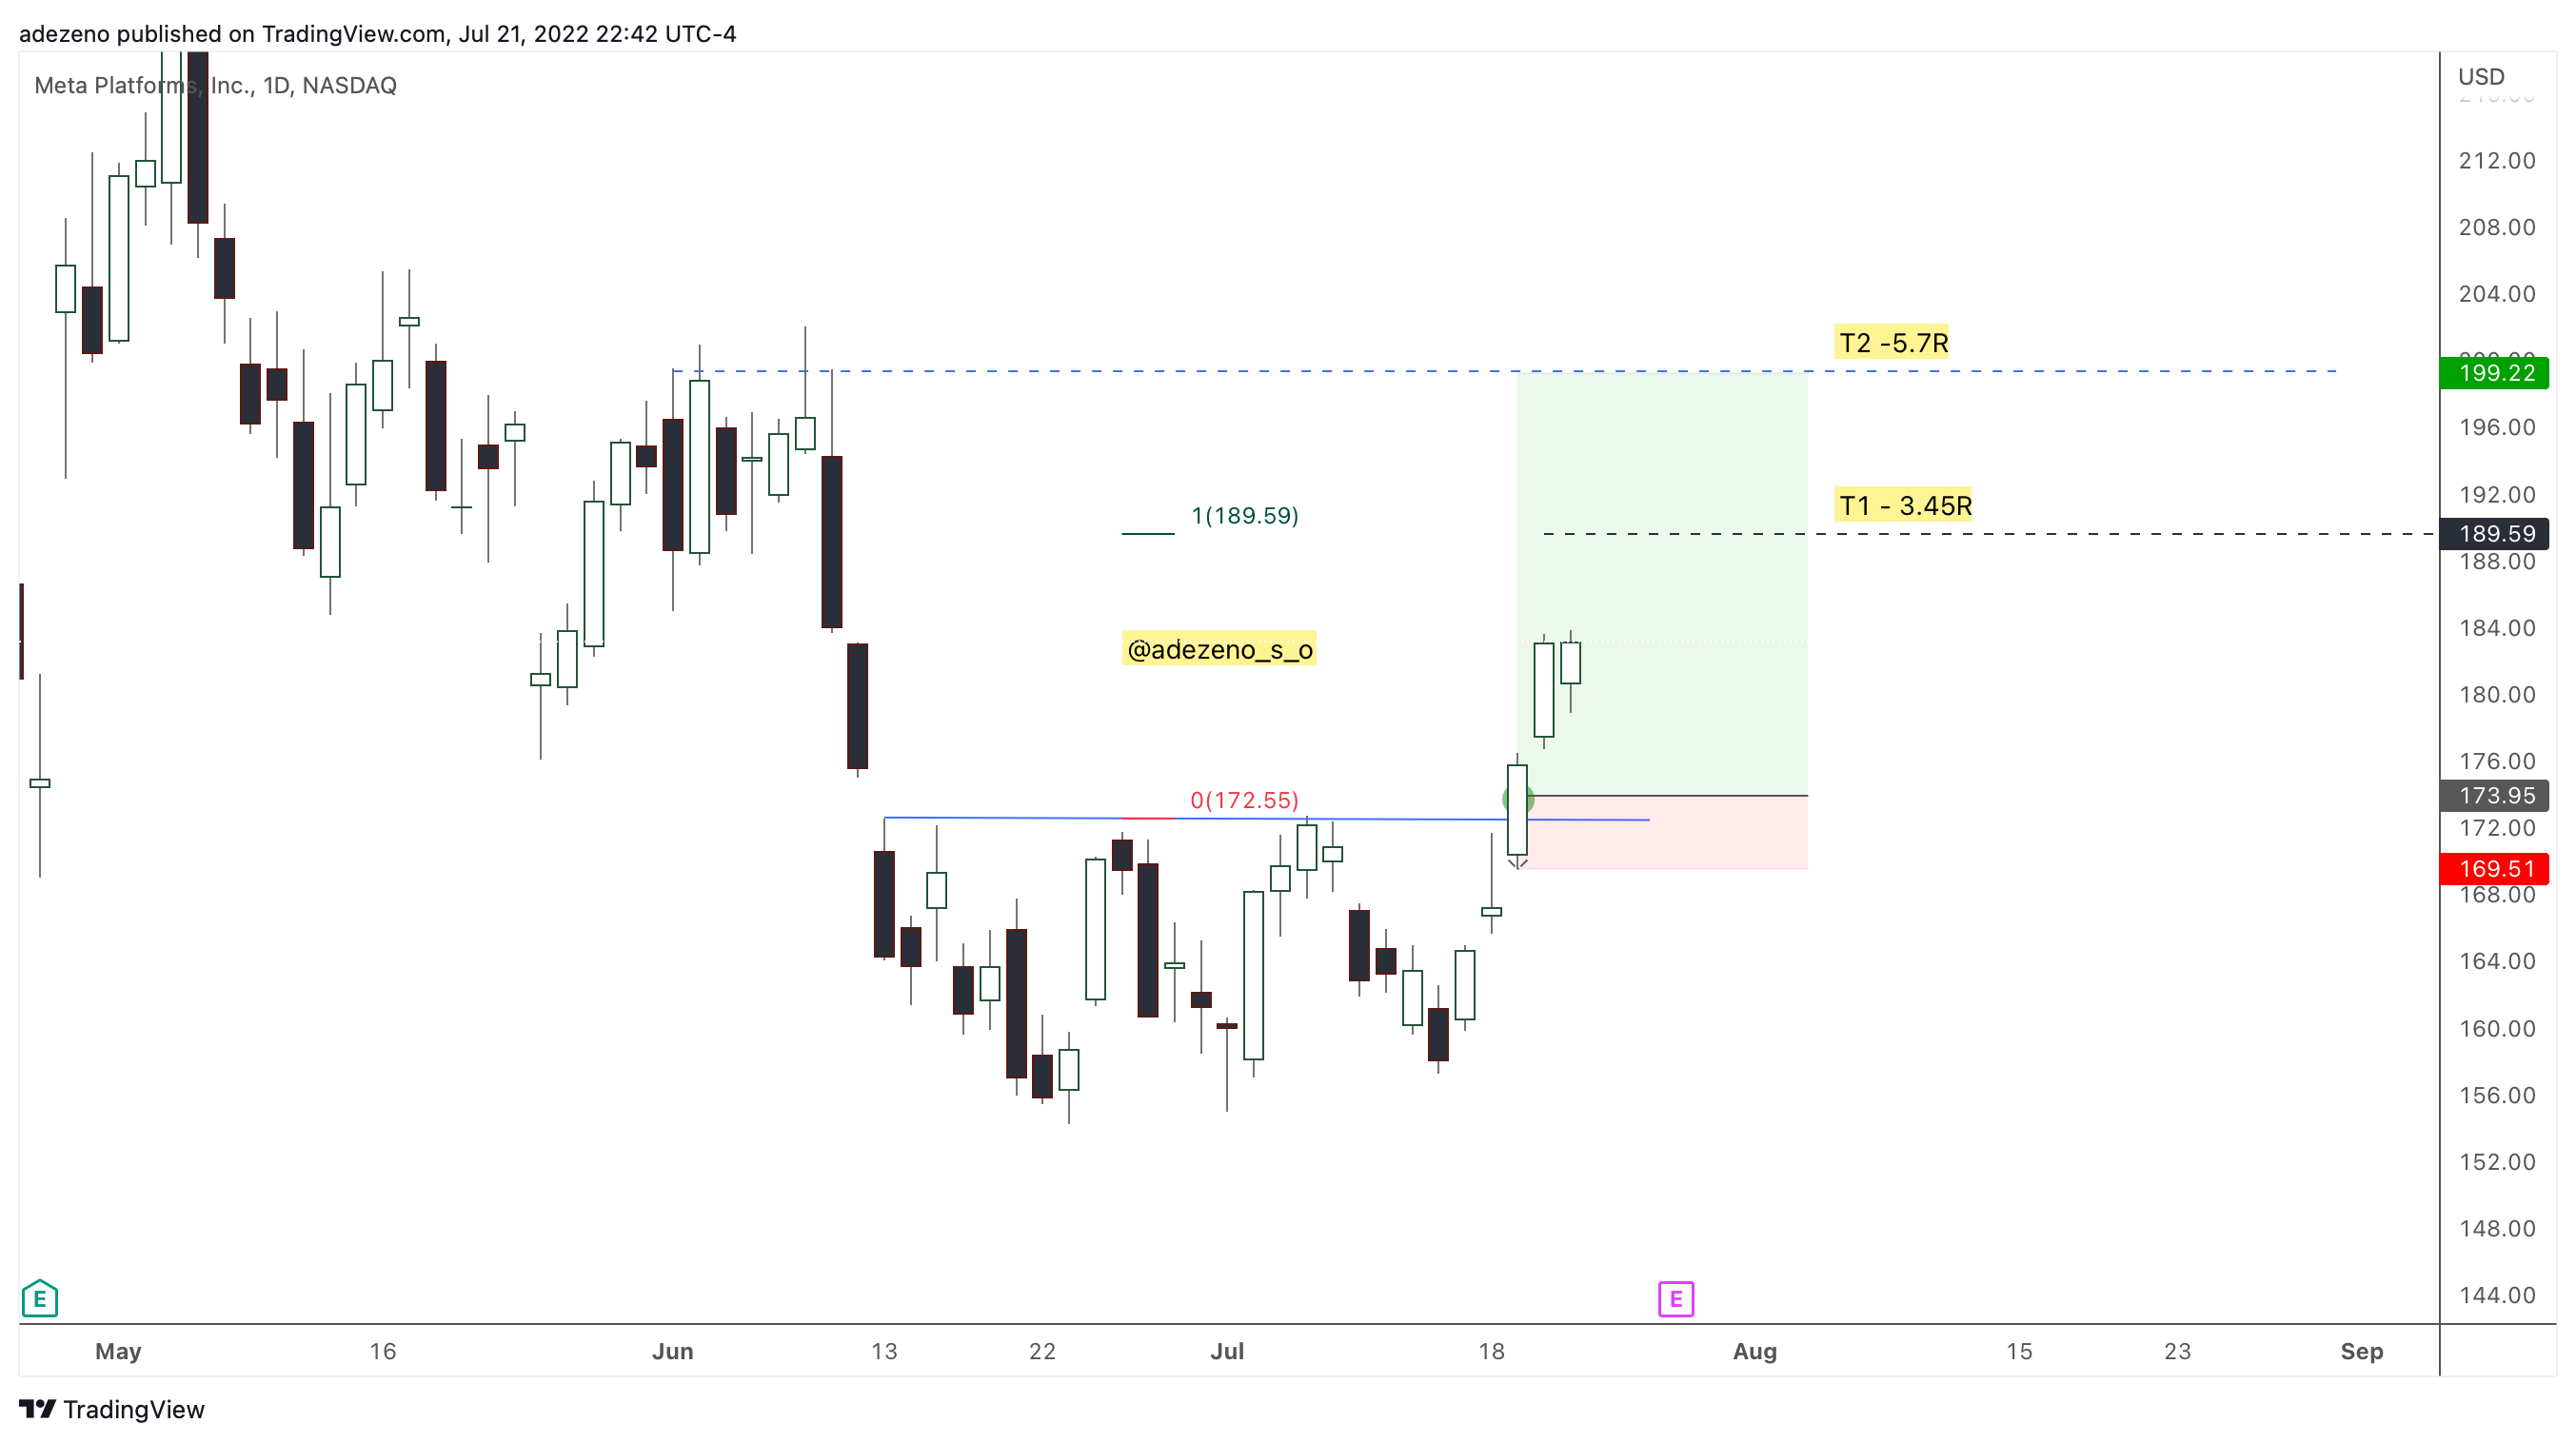
Why is this happening? What causes investors to be bullish on these stocks despite the unfavorable market during the high inflation environment and slow economic growth?
Has the market bottomed? Let me give you a straight answer by looking closely at a chart.
You only need to analyze this chart to know what’s happening. - NASDAQ.
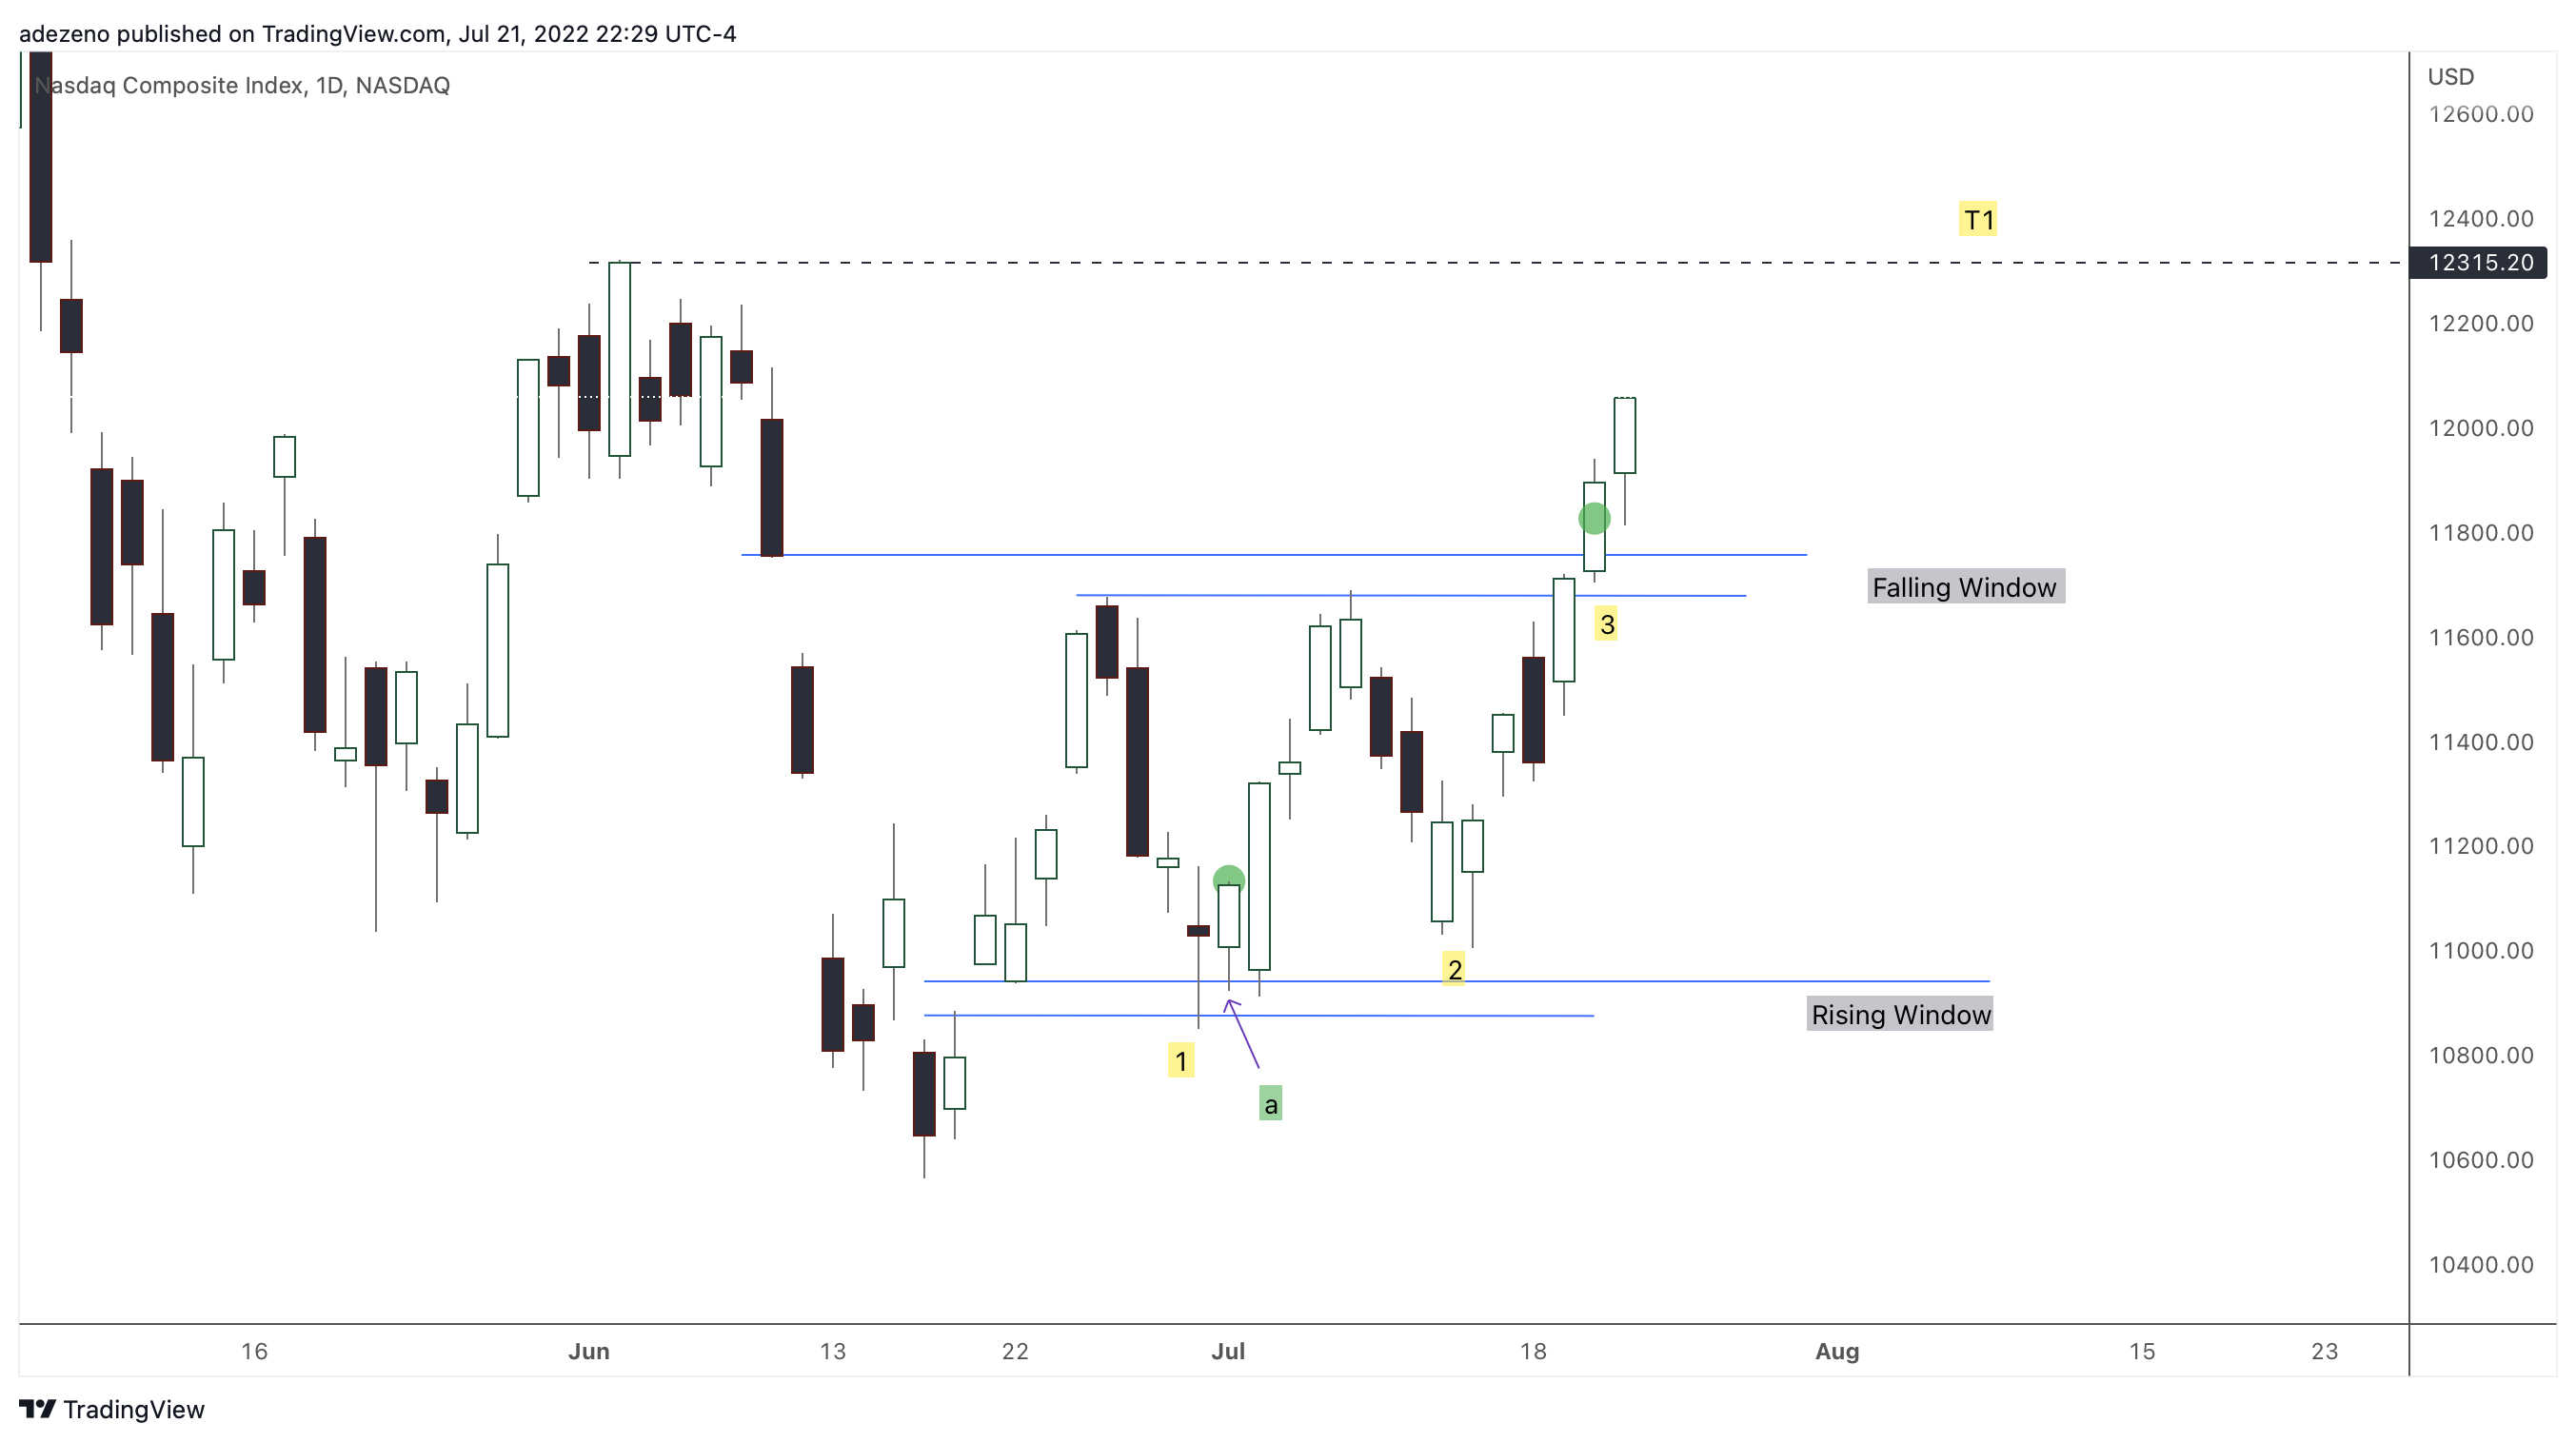
The index makes a higher high; you can see this from C1 & C2 in the chart above.
Ca (candle a) is a good entry as it’s an inside bar that finds support at the Rising Window. If you enter at Ca, your immediate target should be at the falling window above, which will at least give you a 2R (Risk to reward)
C3 broke above the Falling windows, and this makes a good case for a short-term bullish move.
You will notice my trigger point slightly at the middle of candle 3 (C3). I discuss this in my video above.
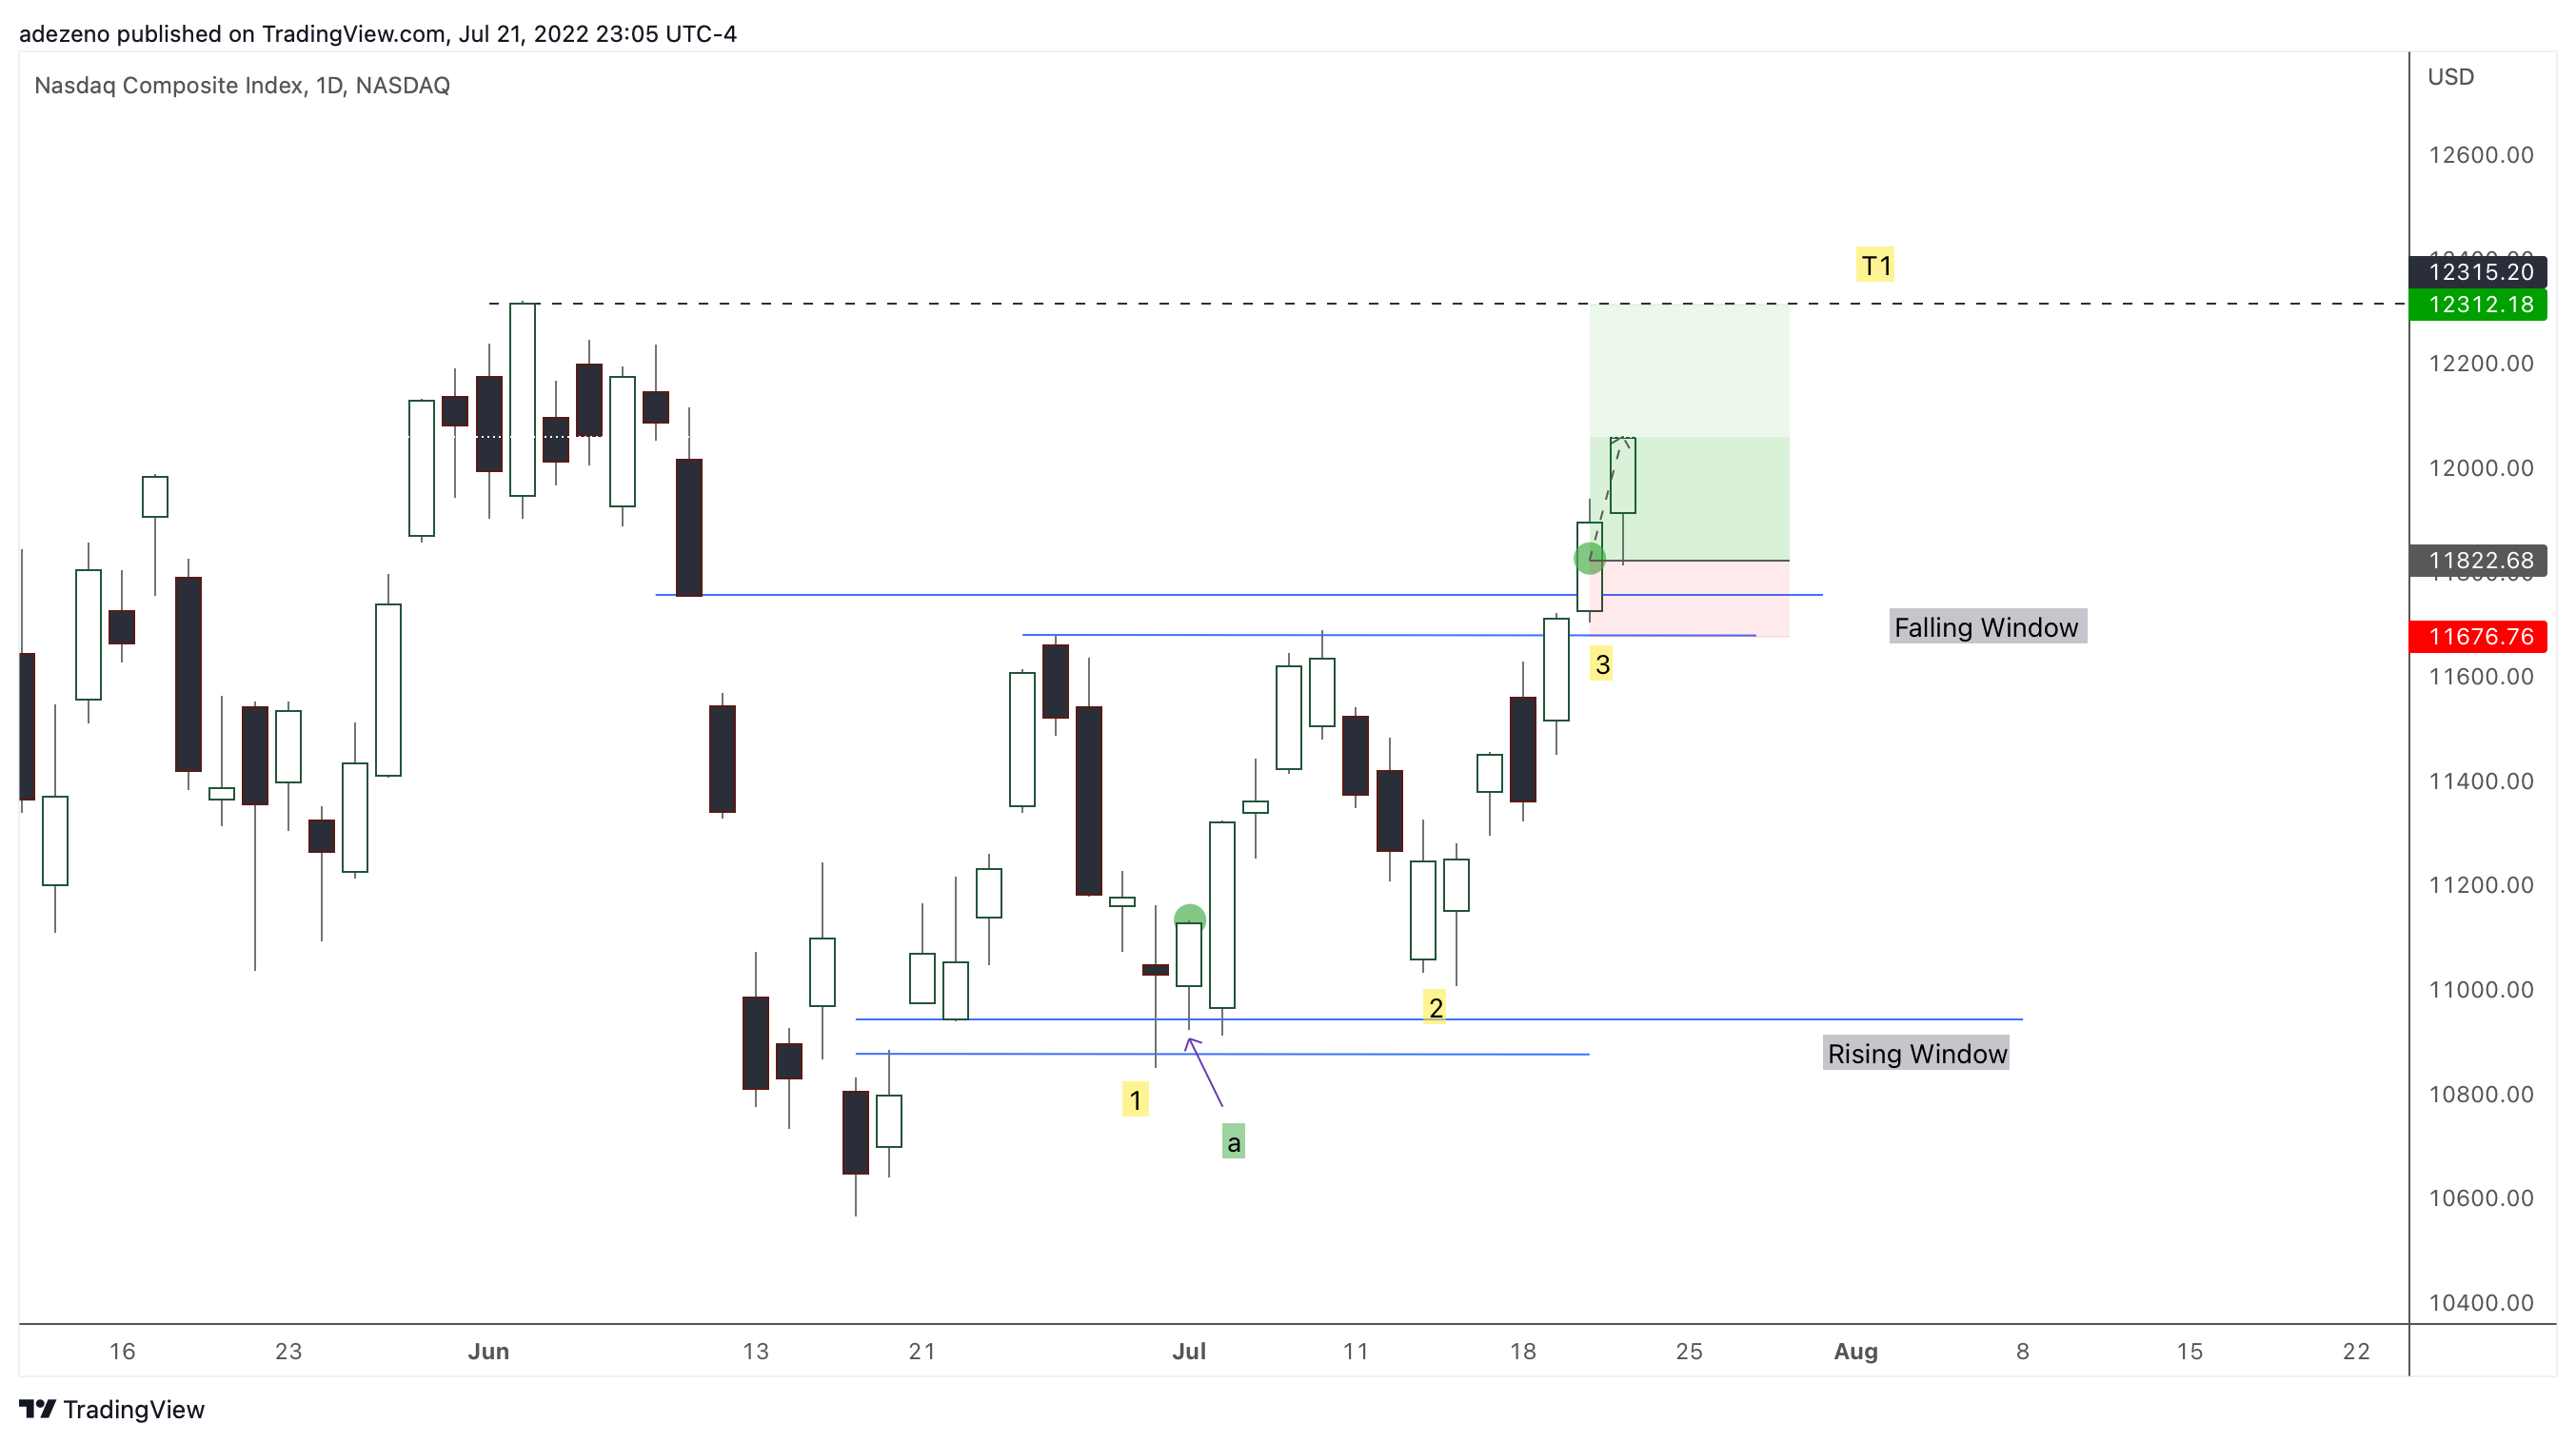
This setup will give the investor at least 3.35R from the green dot. So here you go; this is my short answer to a million-dollar question, why has the market been bullish on tech stocks recently.
Or has the market bottomed? nobody knows
I hope you enjoy this short analysis. Happy weekend. If you love my publications, consider subscribing. There are free versions of this info and a premium subscription where I discuss detailed, in-depth analysis in a short video like the one you see above. 🤓
Watch with a 7-day free trial
Subscribe to adezeno.io to watch this video and get 7 days of free access to the full post archives.
